Pioneer: Architecting The Data Engine
Pioneer: Architecting The Data Engine
Overview / The Challenge
In 2017, the cannabis industry was young, fragmented, and opaque. Brands and investors were effectively flying blind, lacking a "Nielsen" or standard source of truth to validate marketing performance.
I built Pioneer Intelligence to solve two distinct problems:
Micro Optimization: Helping operators understand how their specific strategies, tactics, and messages were being received by the market.
Macro Valuation: Providing a 30,000-ft view of brand health and relative category strength.
To deliver this level of insight, we couldn't simply resell an existing tool. We had to build a proprietary engine capable of ingesting a rich mix of data from a variety of sources across the web.
The Expertise. While engineers wired the system, I architected the logic. I identified the key performance indicators, sourced the data streams, and defined the weighting models. Leveraging my digital background, I engineered the algorithm so it distinguished high-value signals (enduring equity) from vanity metrics (fleeting noise). This nuance helped ensure that the final scores reflected real business impact, not bot activity.
Strategy / The Blueprint
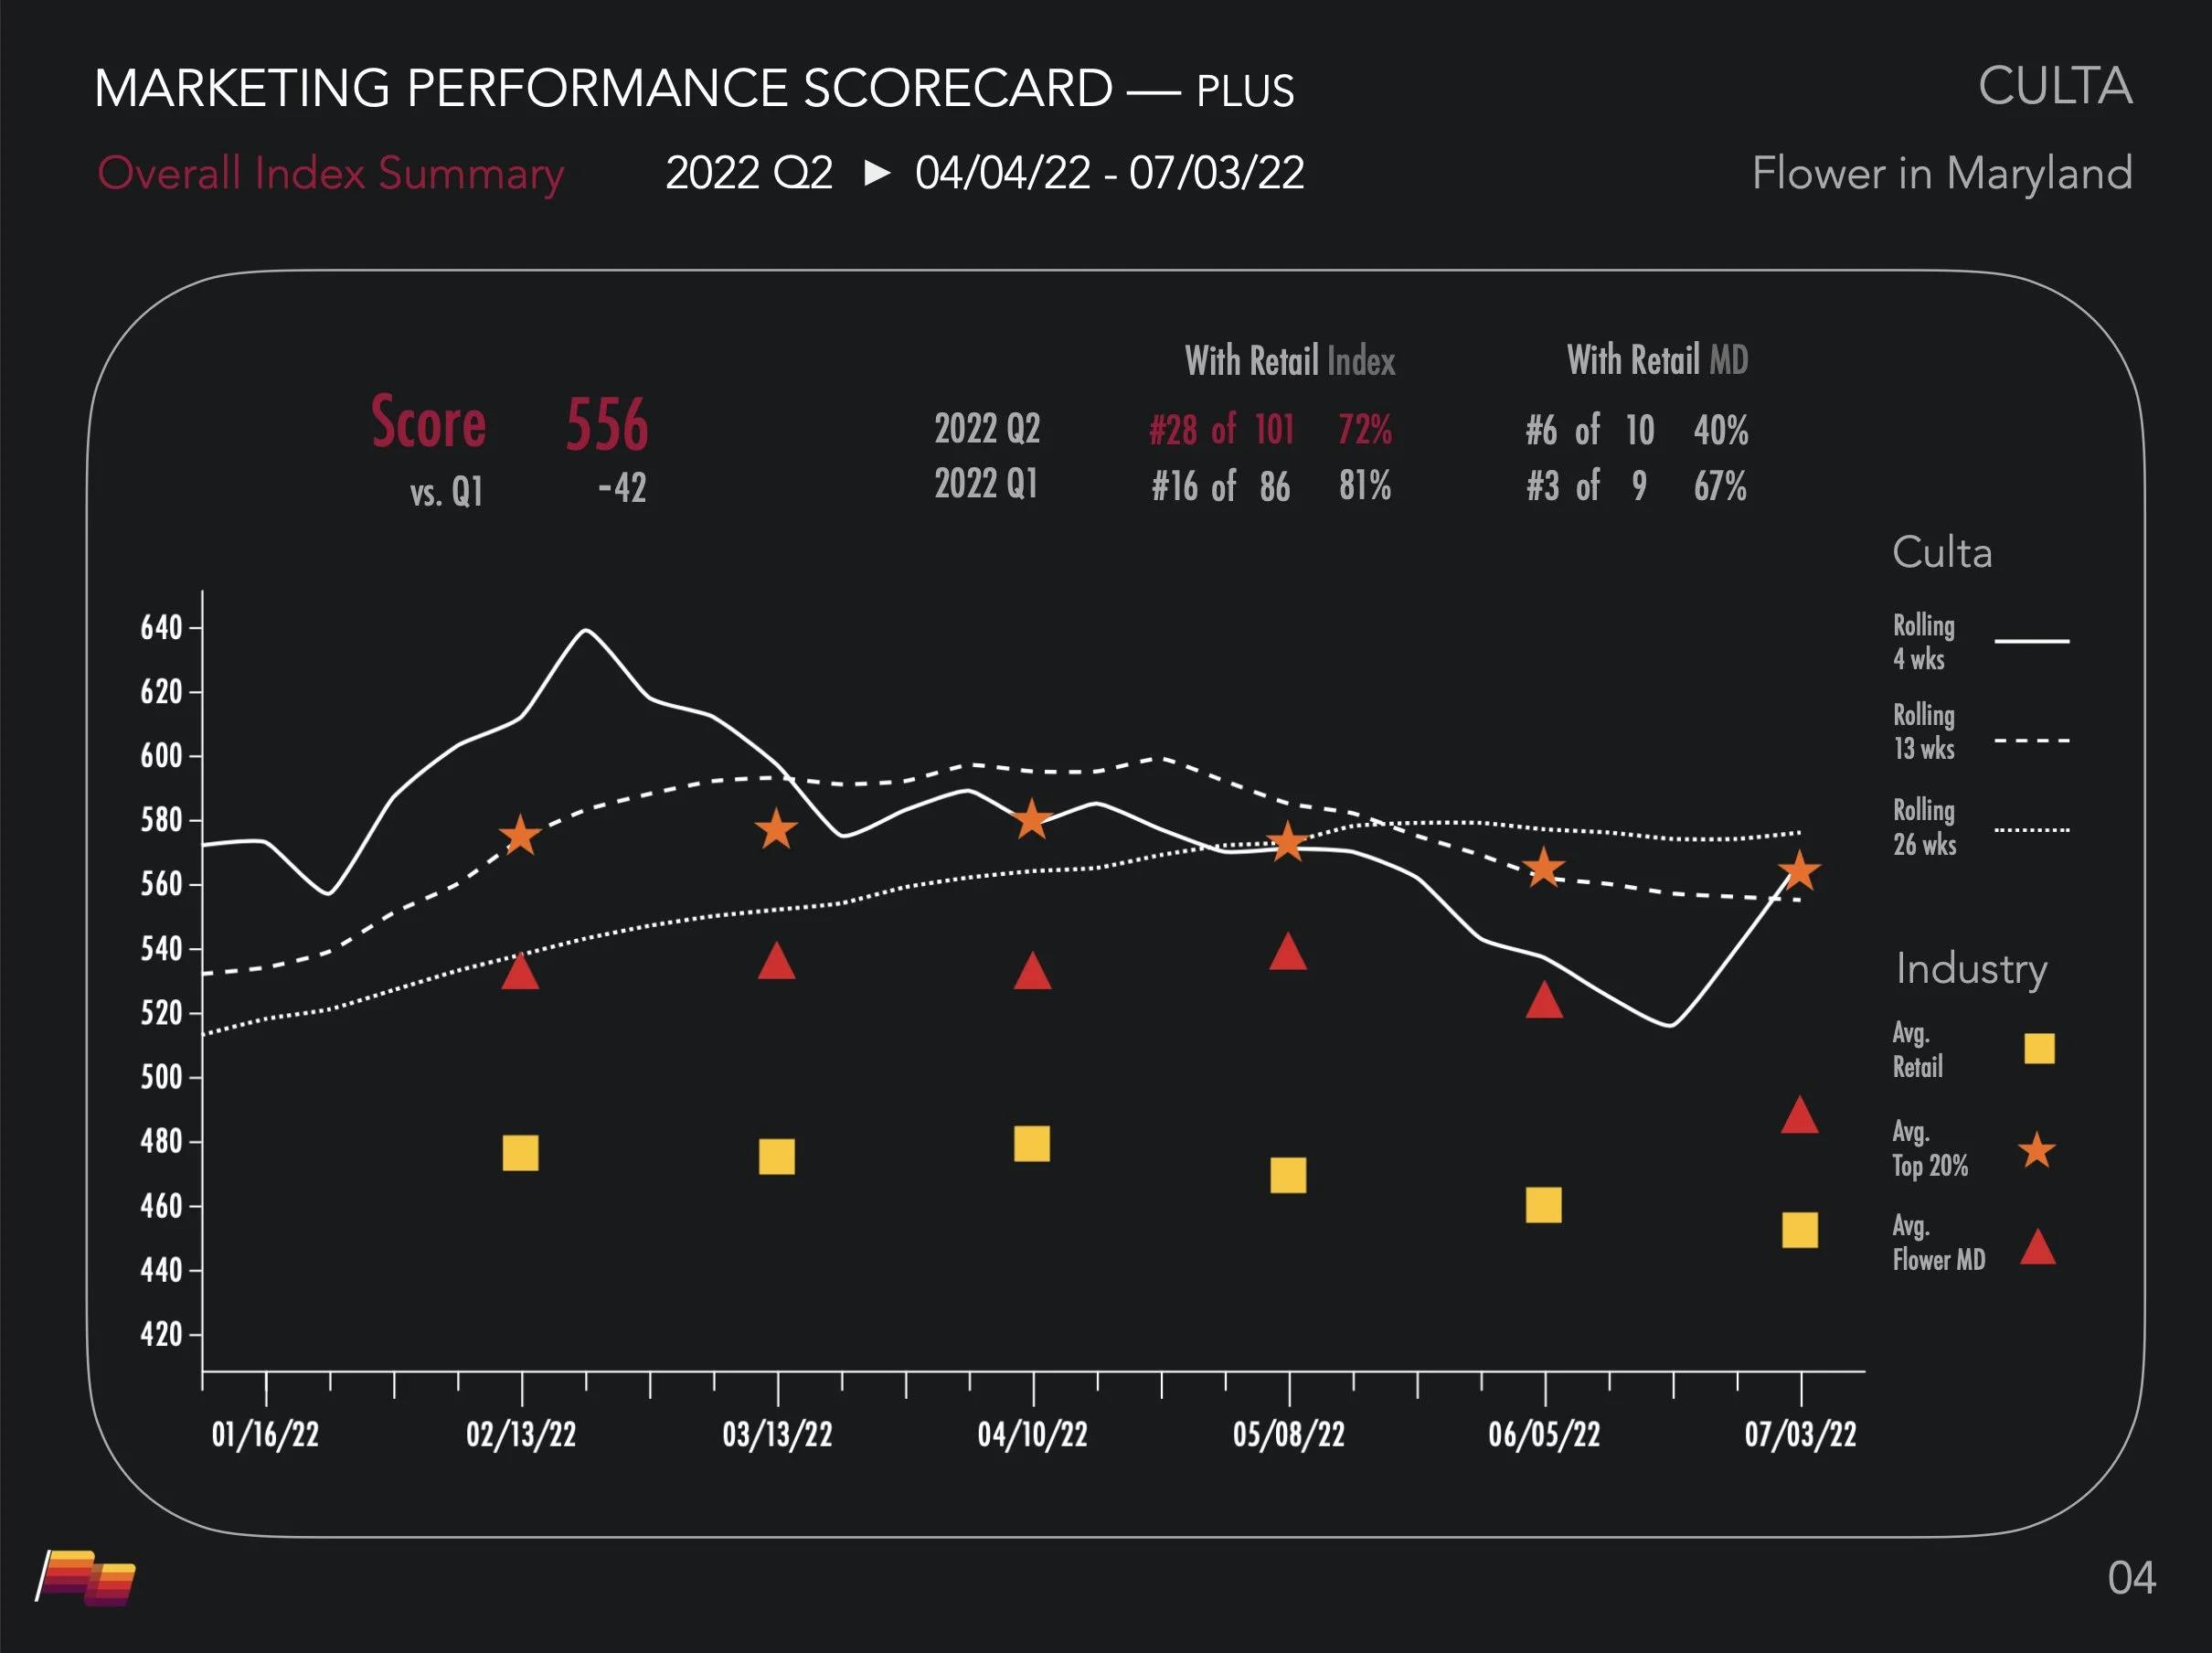
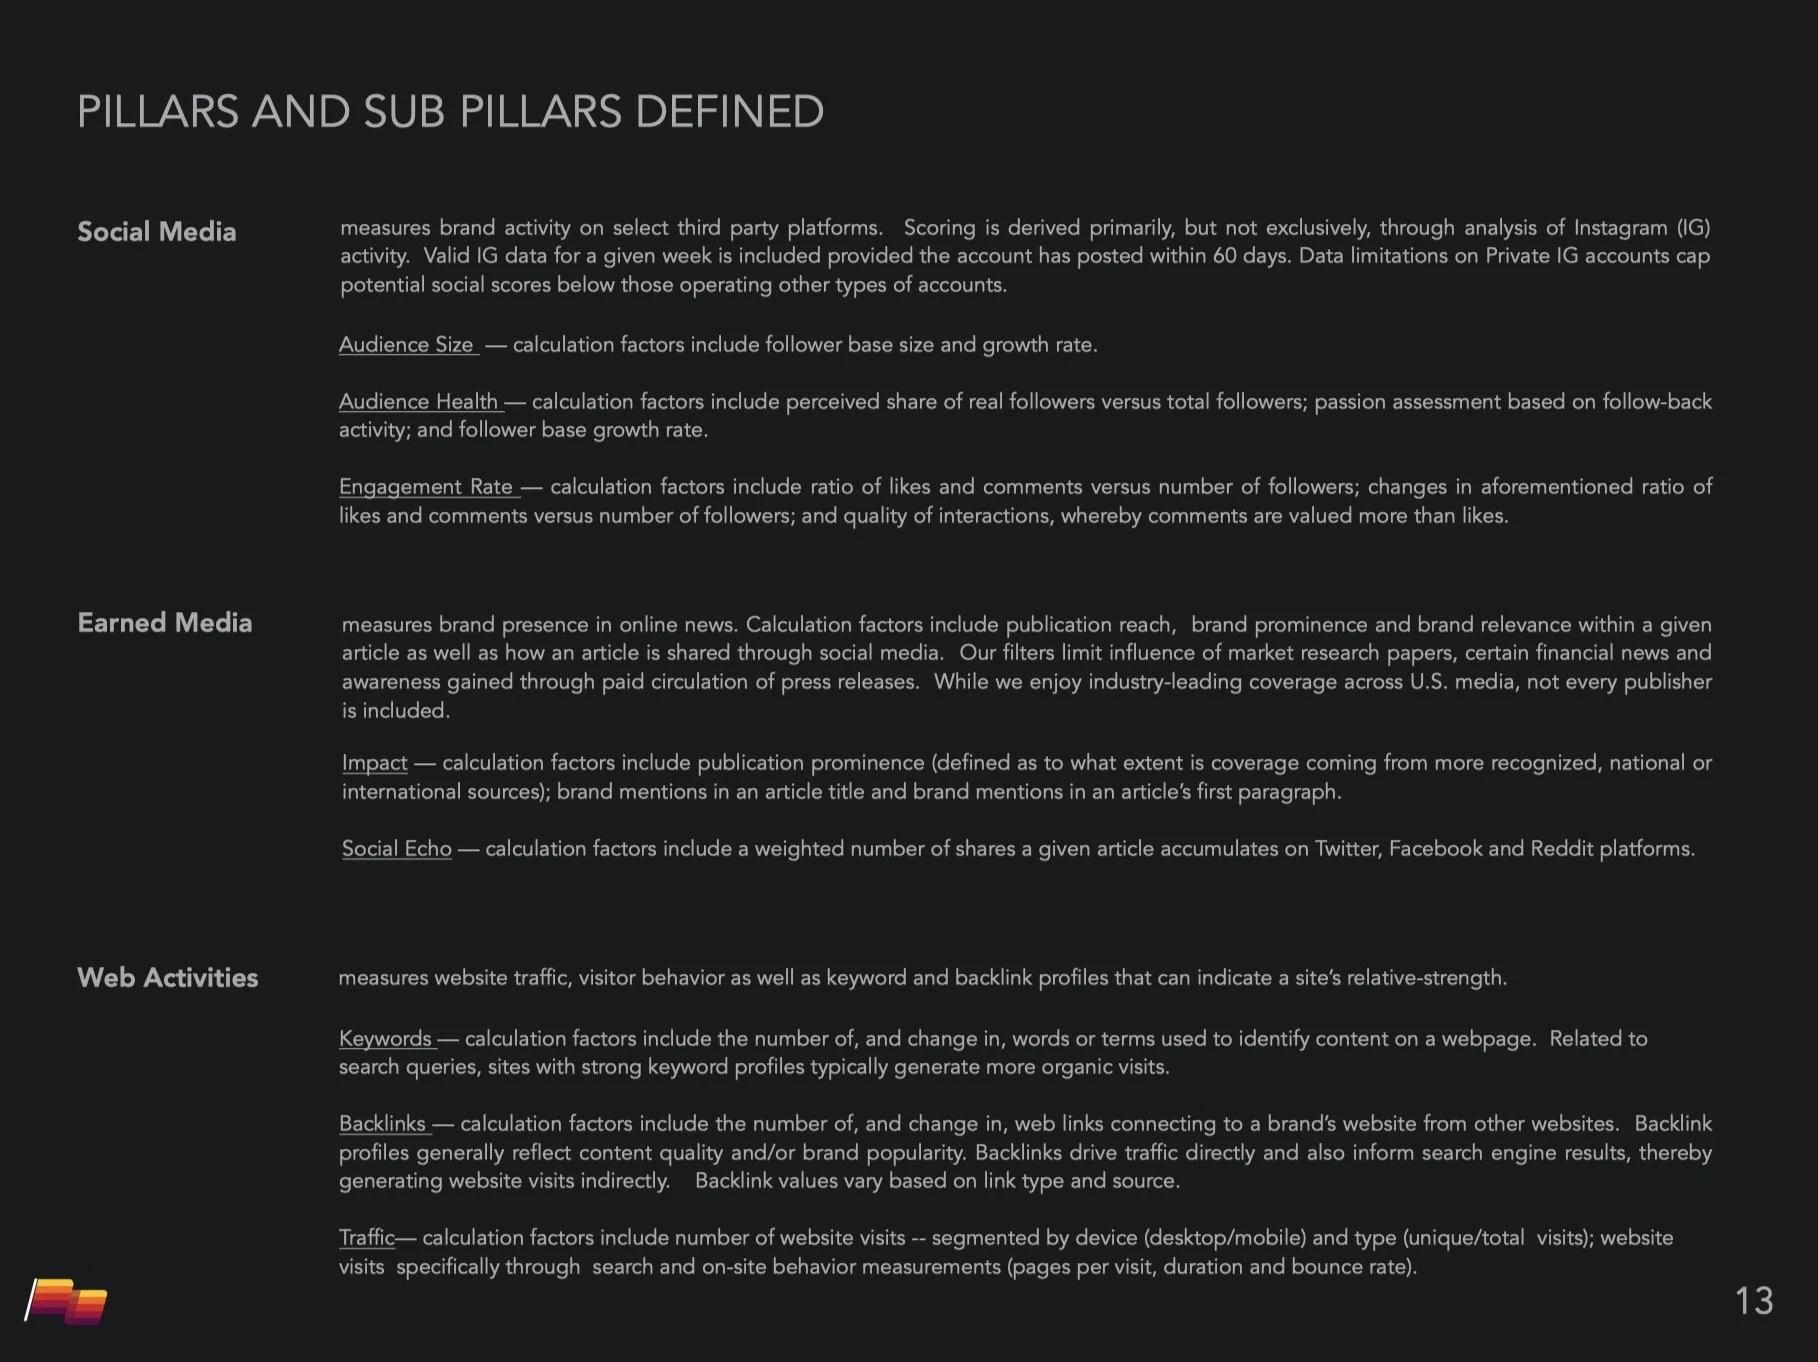
Standardizing the Signal. Our goal was to convert vast, disparate data streams into standardized, quantitative indices. Pioneer Intelligence measured awareness and engagement across social media, earned media, and web activity, distilling performance into two distinct dimensions:
Heat (Relative Momentum): Who is winning right now? (Velocity of change).
Strength (Absolute Position): Who dominates the category? (Cumulative equity).
Operationalizing the Firehose. On the left, custom Boolean architecture acts as a "logic gate," strictly filtering global news to isolate the signal from the noise. On the right, that validated data is normalized and staged, ready to power the master engine.
Execution / The Build
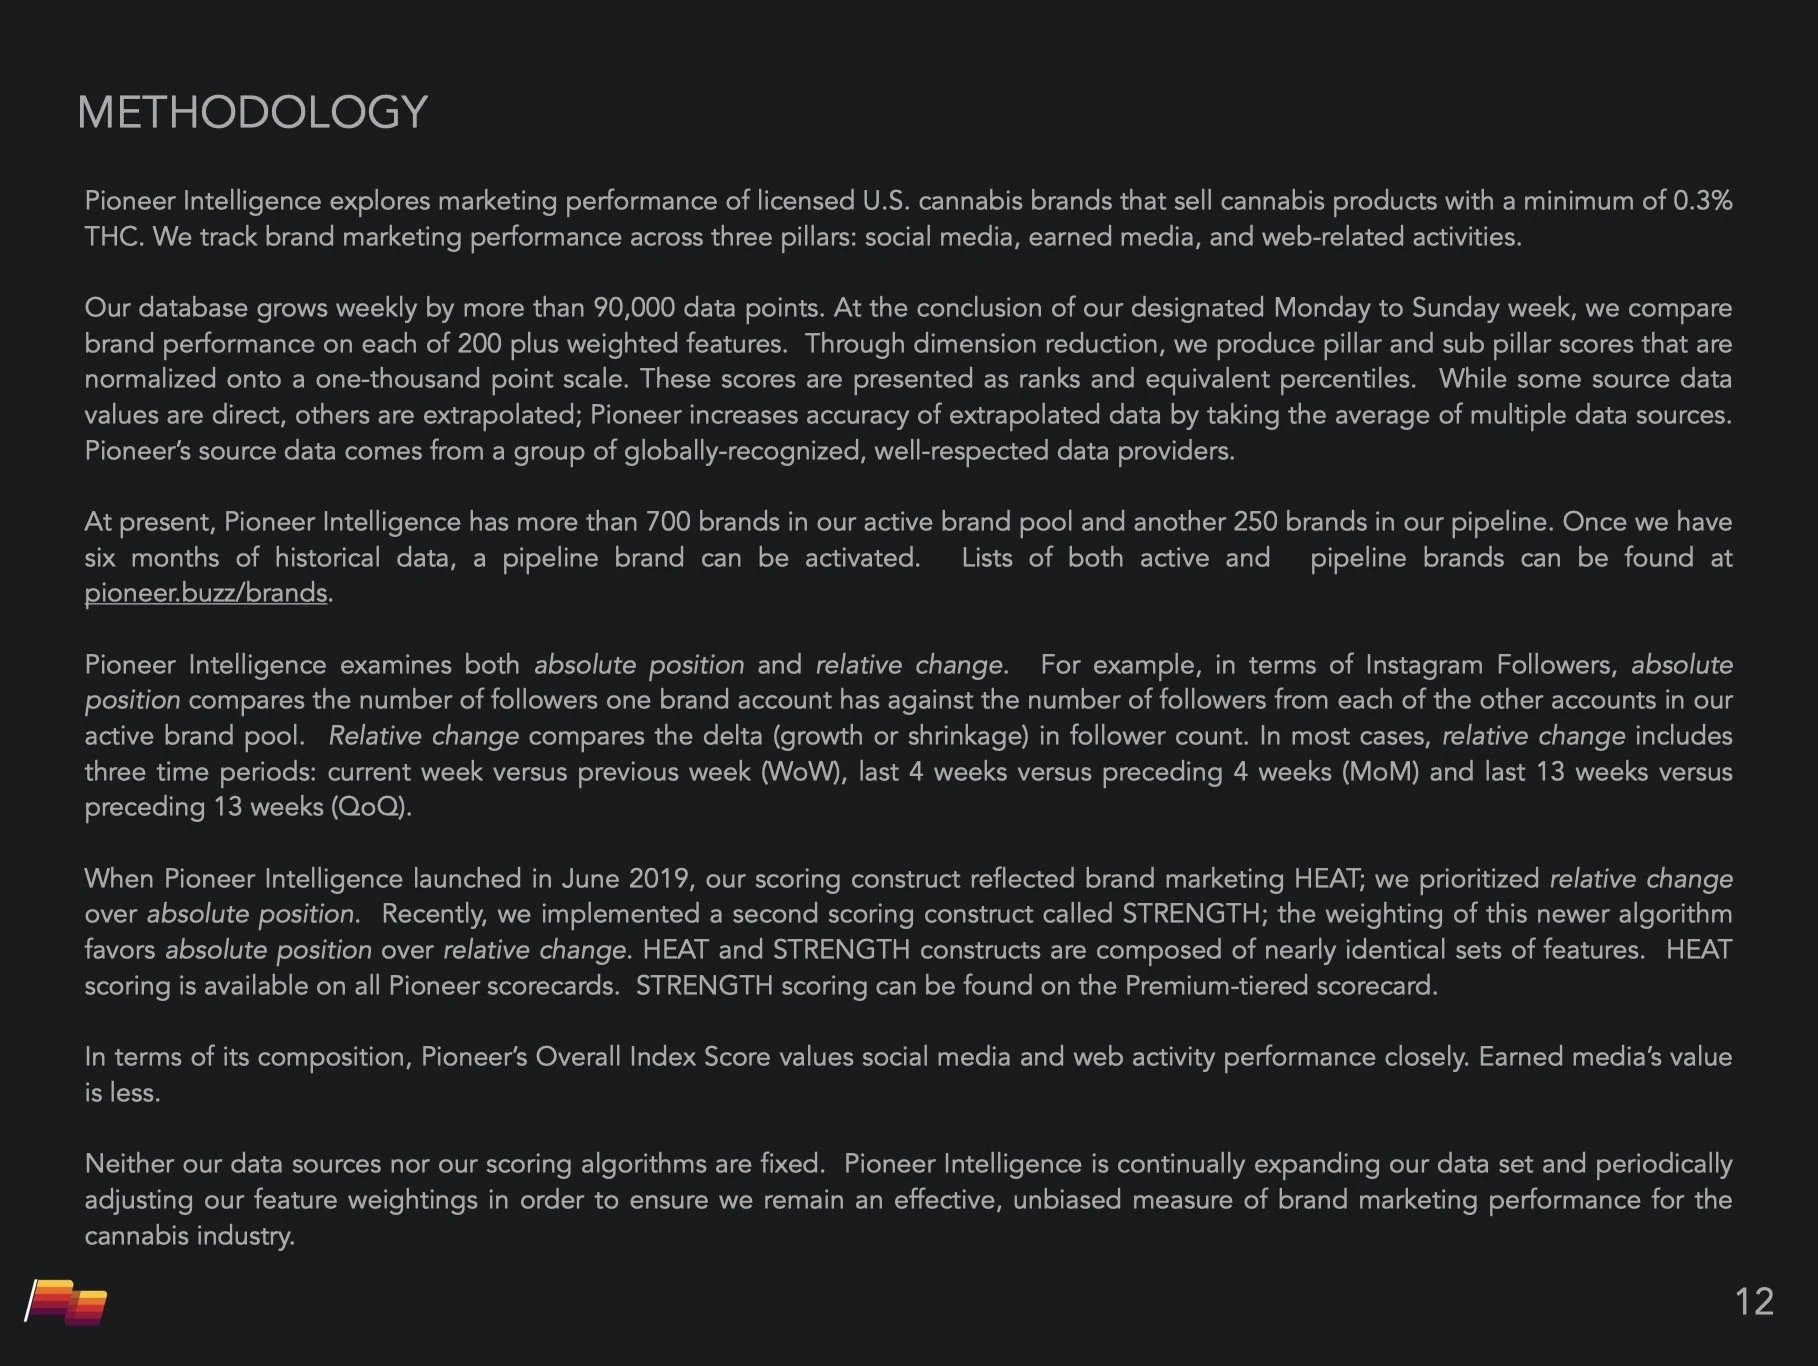
I designed the full-stack ETL (Extract, Transform, Load) pipeline, orchestrating a weekly workflow that ingested 100,000+ data points:
Ingest: We built automated scrapers and API connectors to pull raw activity from a comprehensive stack: Meta, Meltwater, Ahrefs, SimilarWeb, SemRush, and Weedmaps.
Normalization (The CID System): We architected a master Canonical Brand ID (CID) layer. This acted as the universal translator, mapping messy naming conventions from seven different platforms into a single, unified entity record.
Sanitization & Outlier Detection: We coded algorithms to automatically flag anomalies—handling missing data weeks or suppressing statistical outliers (like bot-driven spikes)—ensuring the final index was driven by human behavior, not API errors.
The Scoring Engine: A weighted logic model processed 200+ features across the three pillars. Crucially, the engine calculated Week-over-Week, Month-over-Month, and Quarter-over-Quarter deltas, allowing us to isolate velocity and understand performance in the context of time.
Automated Publishing: The pipeline auto-exported rankings directly to our public WordPress site and generated rich, client-ready scorecards (PDFs) and analyst-primed CSVs instantly.
Results / The Metrics
We successfully turned a manual consulting task into a scalable software product.
Scale: Successfully benchmarked 750+ brands weekly, processing >100k data points per run with high reliability.
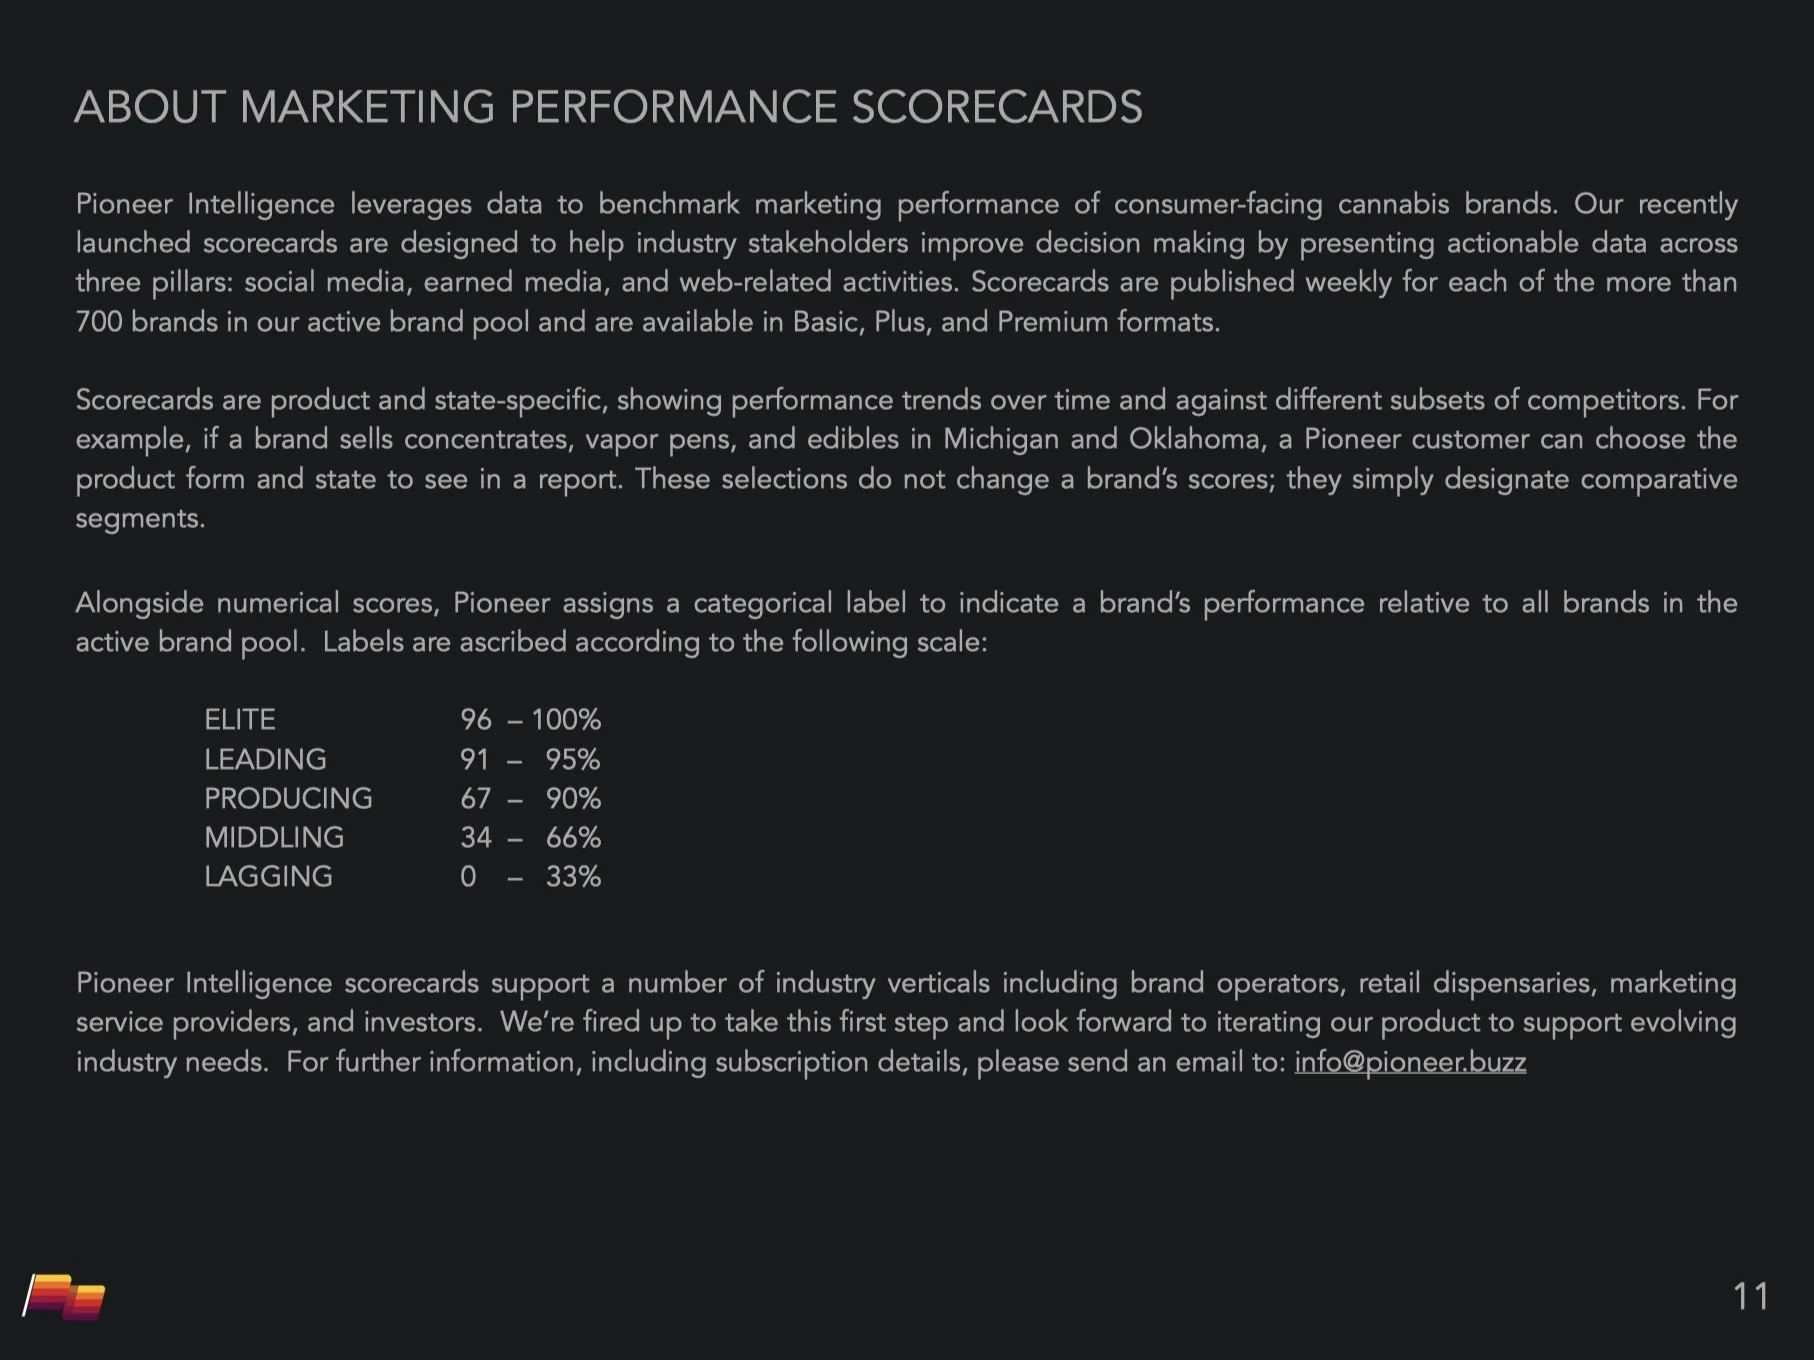
Productization: The Pioneer Index became an industry standard, giving operating clients a normalized yardstick to measure marketing efficacy against competitors.
Efficiency: Automated the Ingest > Score > Publish loop, reducing what would take a team of analysts weeks into a machine-driven weekly sprint.
Learning / The Takeaways
Rigor breeds credibility. In a fragmented, opaque market, the algorithm is only as valuable as the trust behind it. By publicly publishing our exact methodology and pillar definitions, we converted a black box into a transparent standard. The depth of the documentation wasn't just for operations; it was our strongest marketing asset.